ImageNet Pre-computed Memorization and Influence Value Estimates
We provide pre-computed memorization and influence value estimates on ImageNet for download here. The estimates
are computed by training 2,000 ResNet-50 models, each on a random 70% subset of the full ImageNet training set.
-
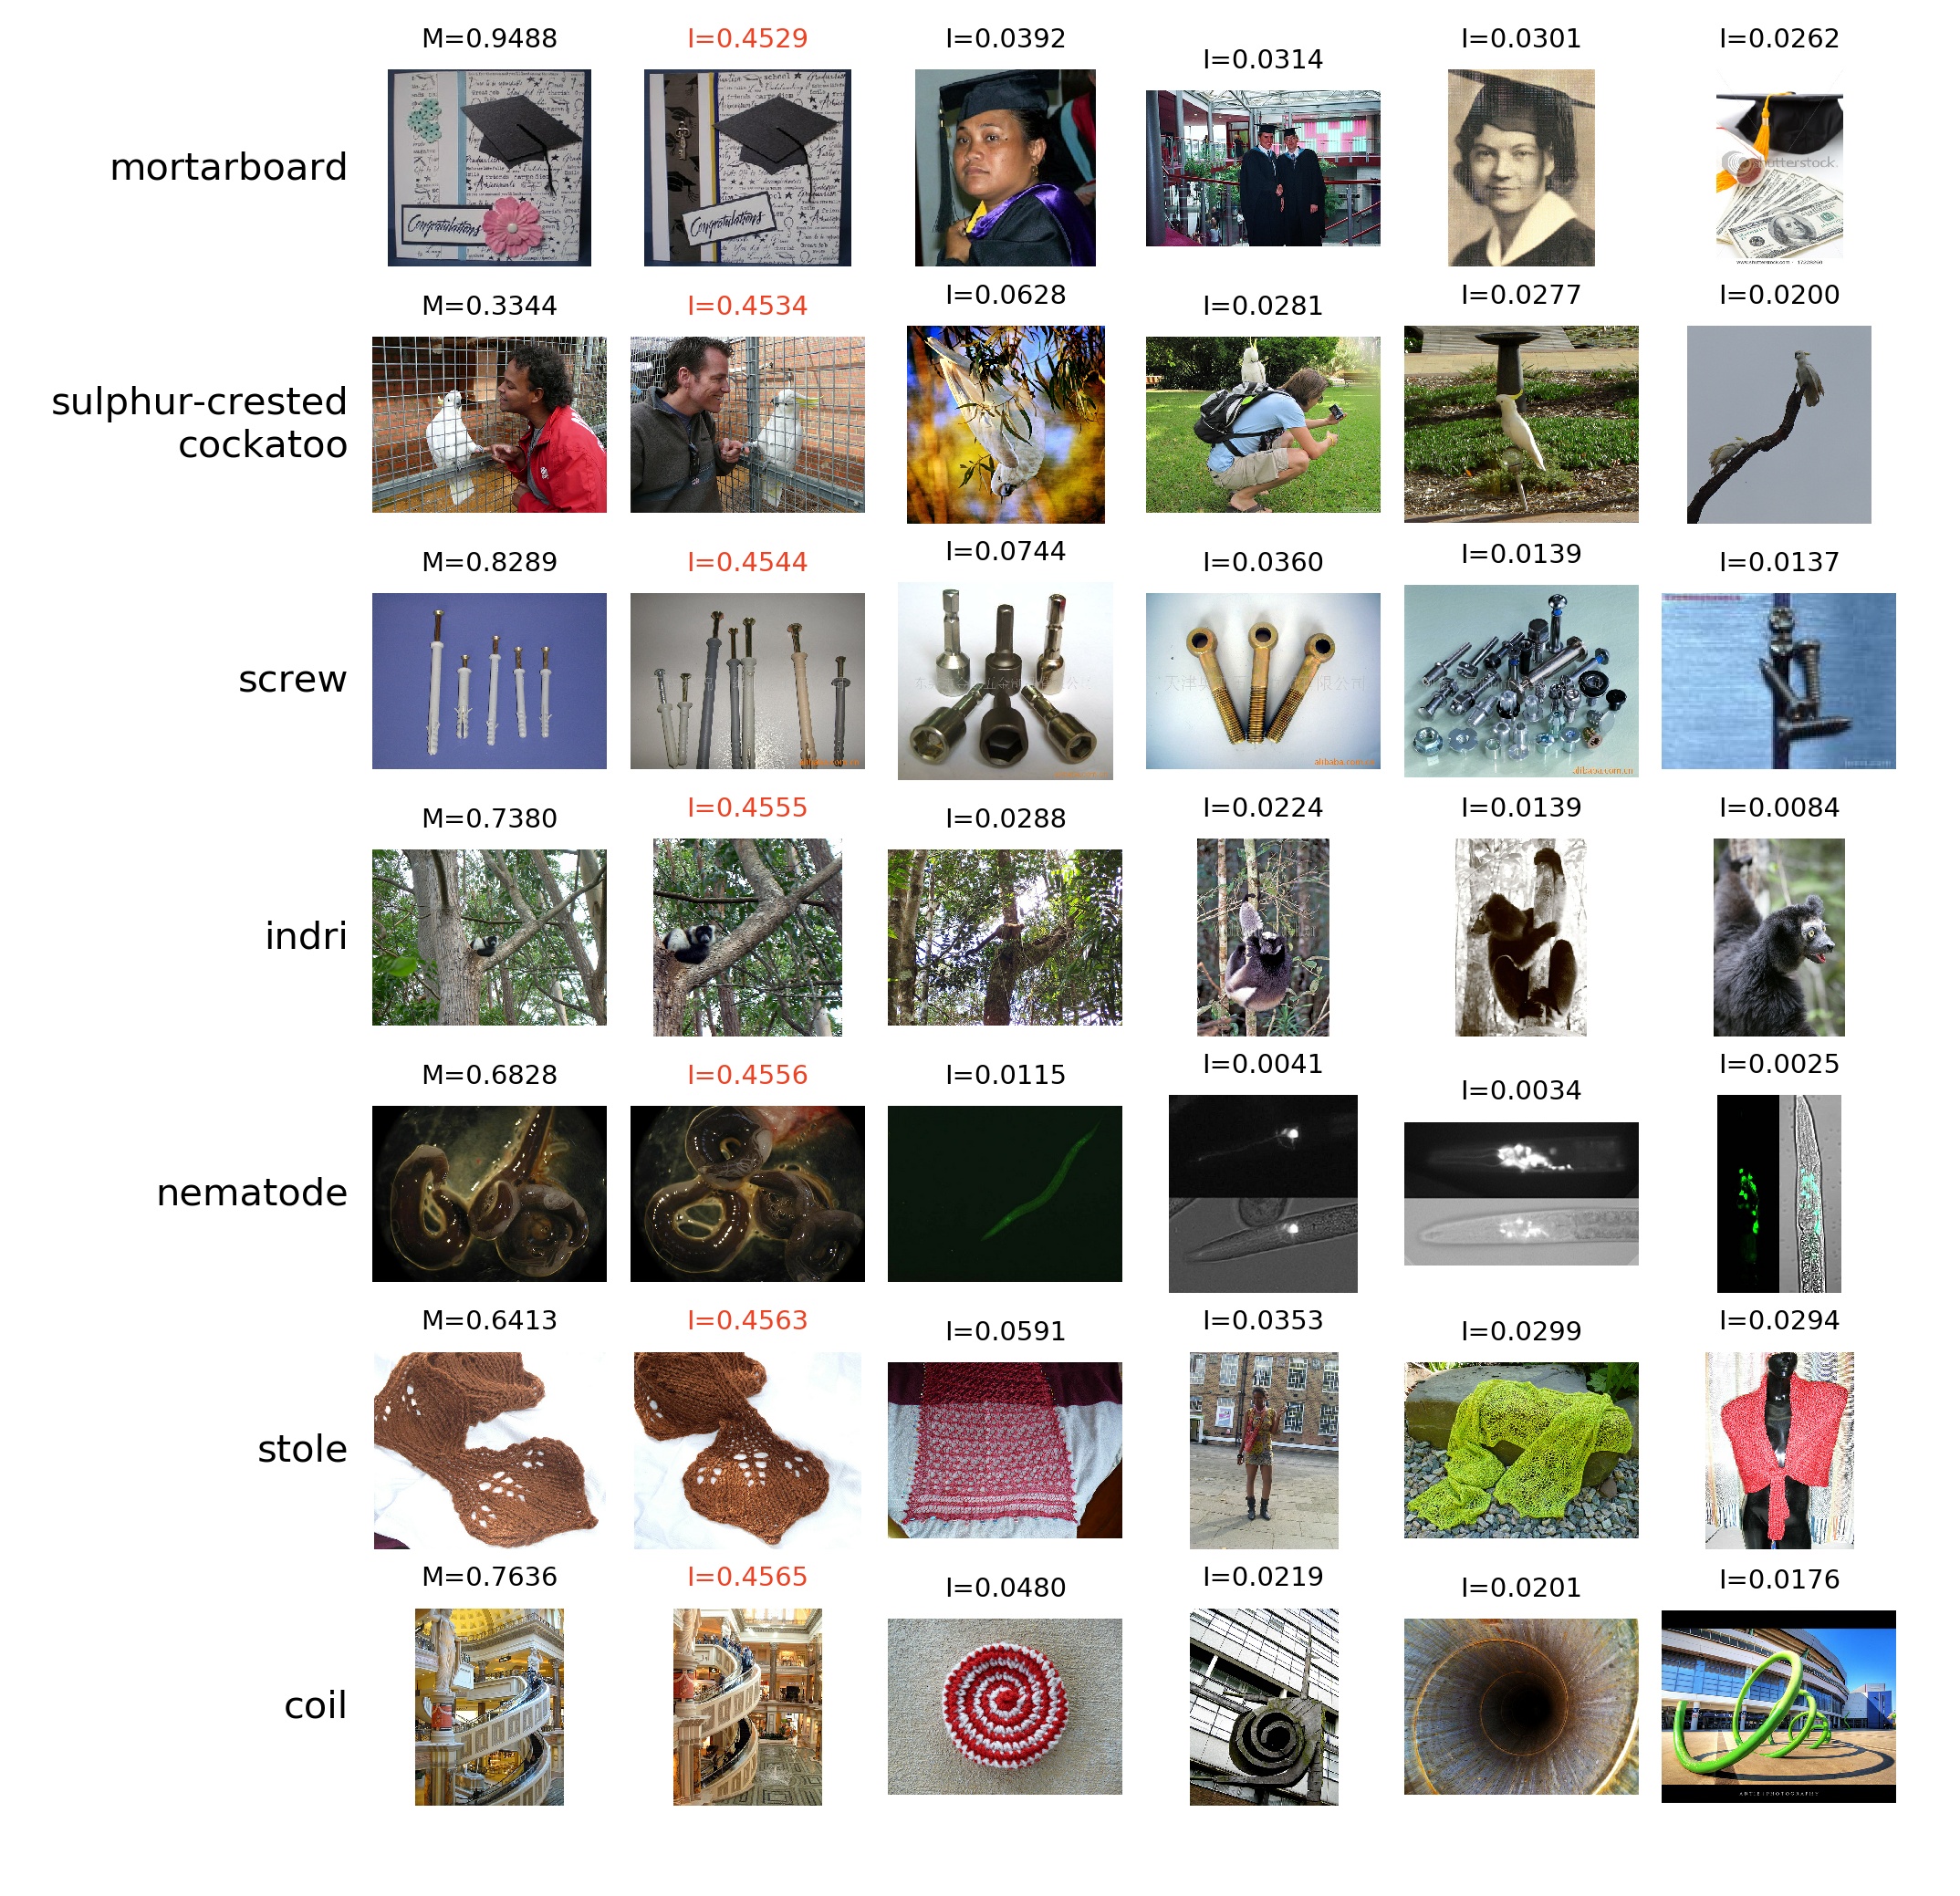
High-influence pairs
contains four arrays of equal length.
tr_idx and tt_idx contains the
index of the training and test examples, respectively, from each of the selected high-influence
pairs. infl contains the influence value estimates of each pair, and mem contains
the memorization value estimates of the training example in each of the selected pairs.
-
ImageNet index contains indexing information. Since there is
no pre-defined order of the ImageNet images, we choose an arbitrary data order in our experiments.
In this file, we provide the image filenames and labels listed by the data order in our experiments
to help identifying the images associated with each influence and memorization value estimates. In particular,
tr_filenames and tr_labels contains the filenames and labels of the training set.
tt_filenames and tt_labels contains the filenames and labels of the test set.
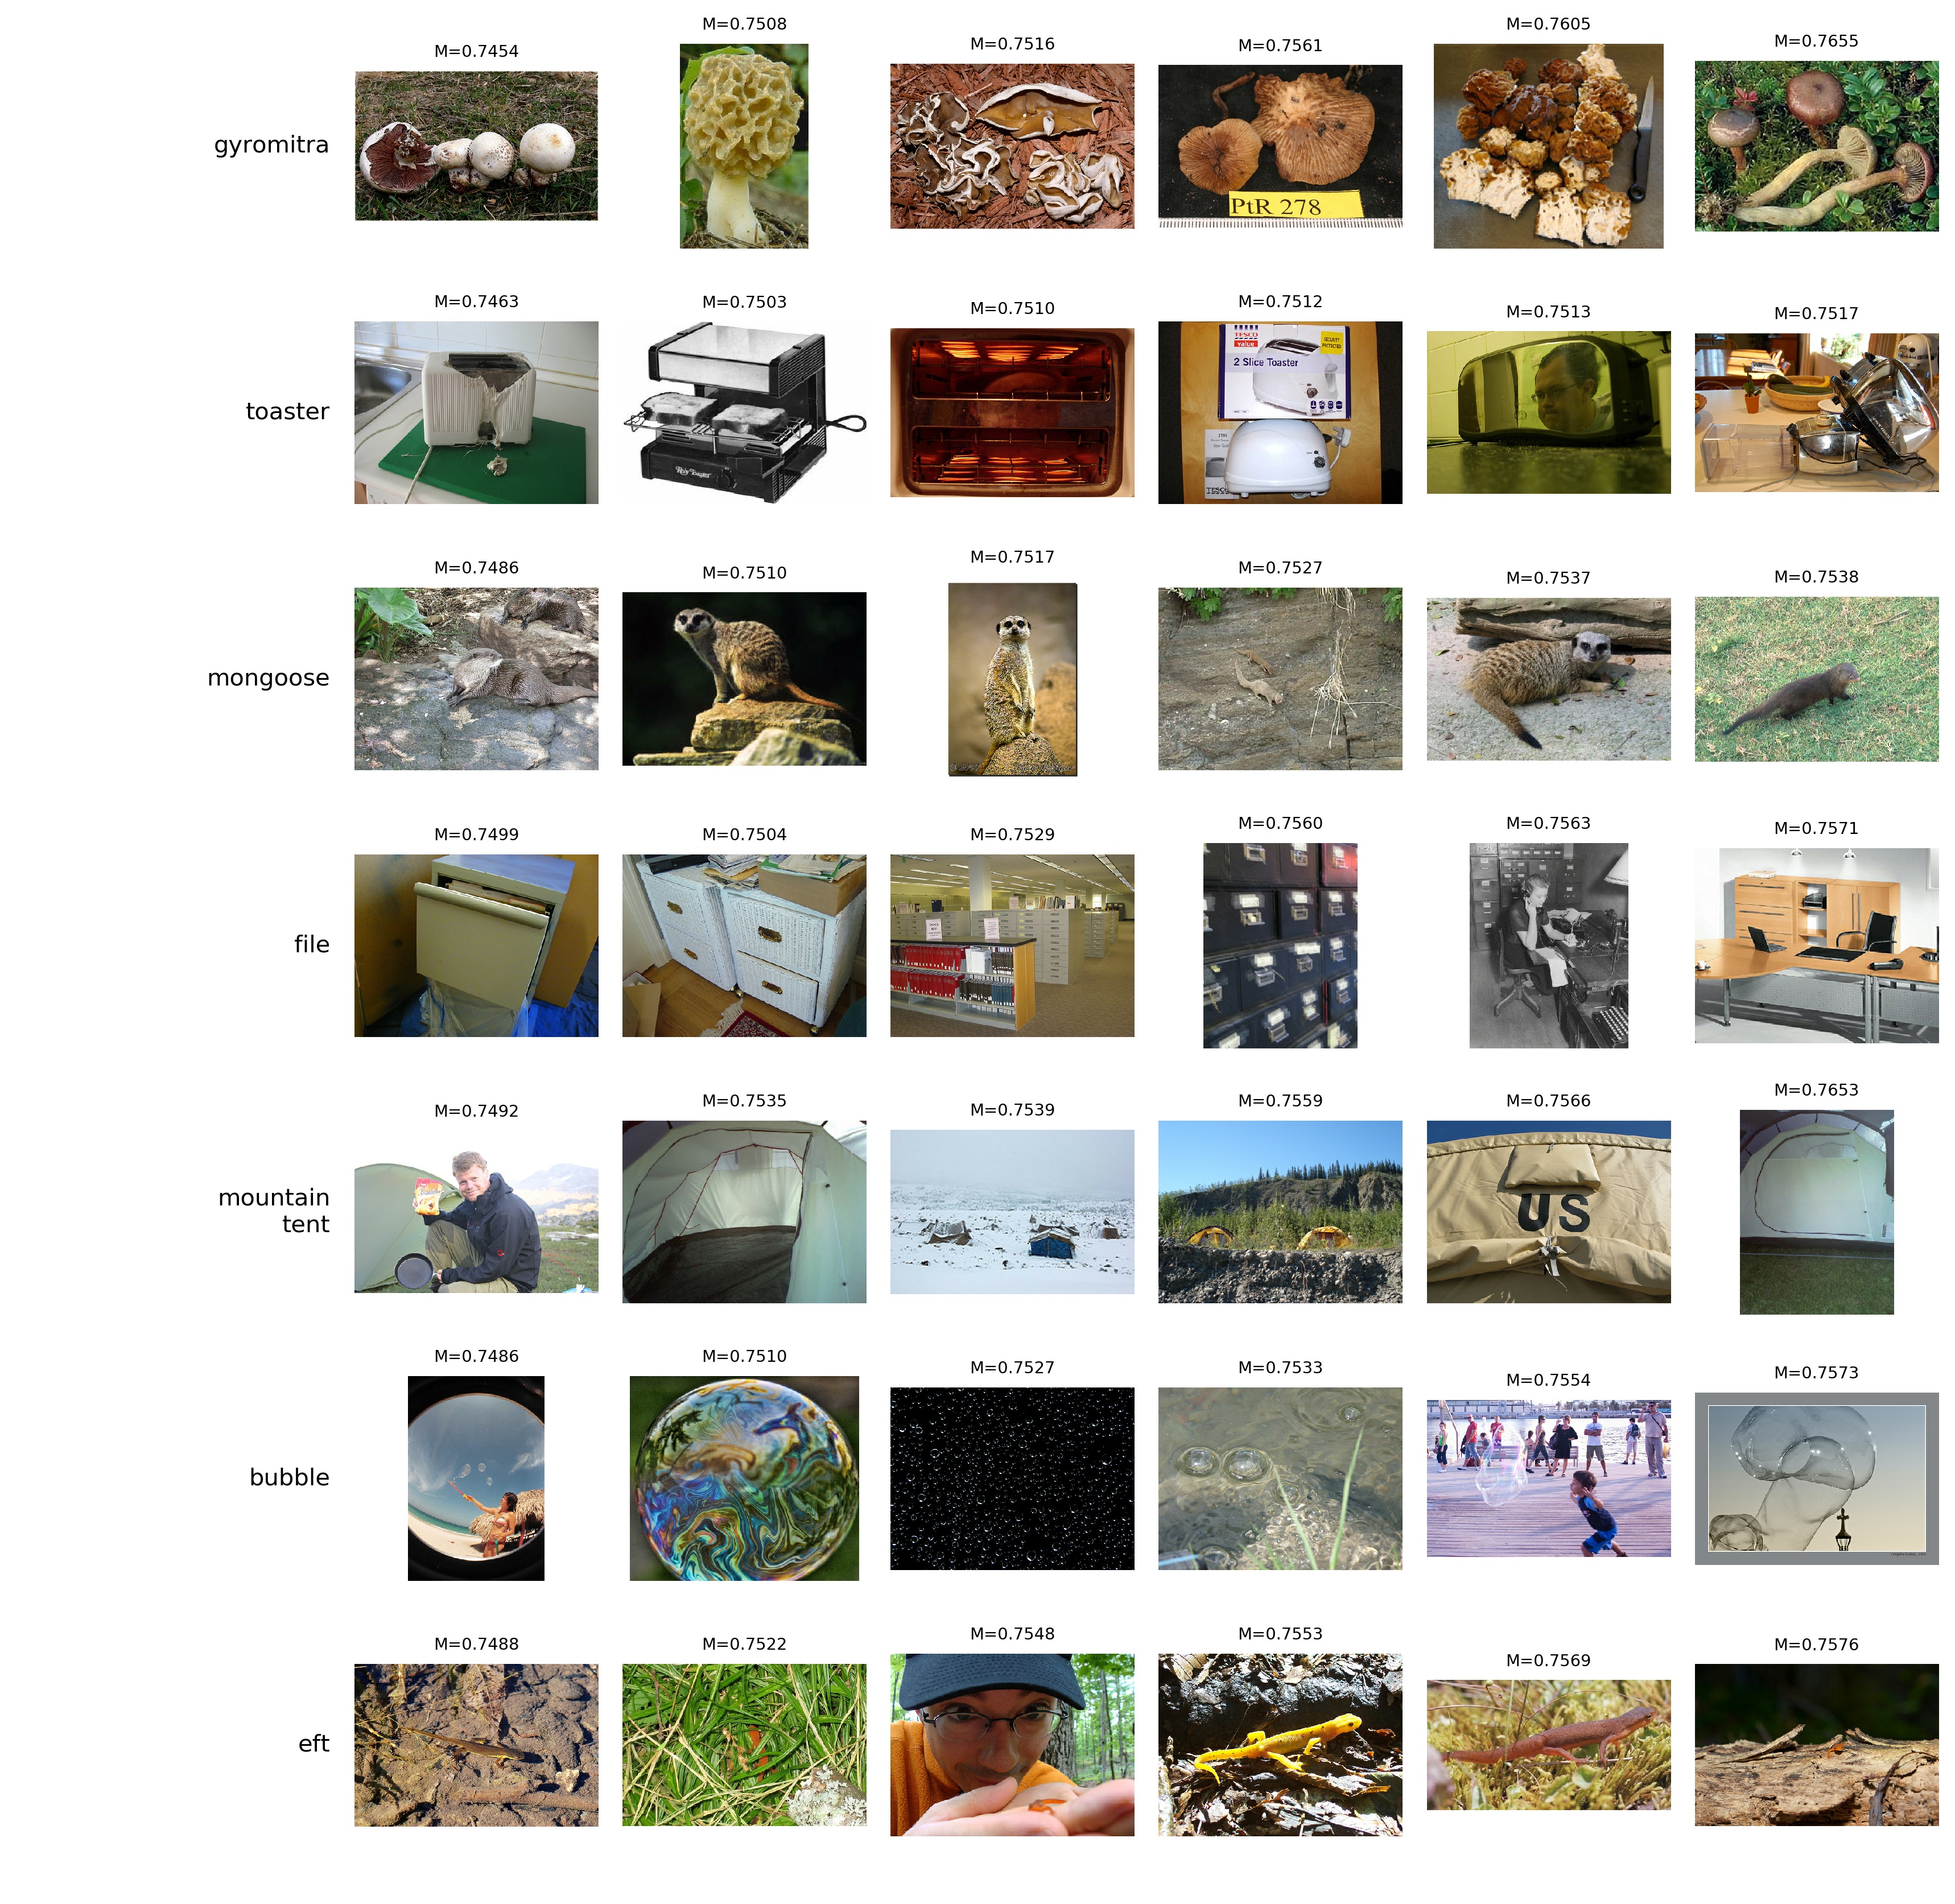
We also provide tr_mem which contains the memorization value estimates for all the training examples.
See here
for an example of using this information to build an ImageNet tfrecord dataset with index information from
the raw ImageNet images.
-
Class-wise influence matrices contains the
n_train-by-n_test influence matrices for each class. Because the influence matrix over the
entire training and test set is too big (250 GB+), we only provide the per-class influence matrices. For
each class K, the array tr_classidx_{K} and tt_classidx_{K} provides
the index of examples that belong to class K in the training set and test set, respectively.
The value infl_matrix_class{K}[i, j] is the influence value of the i-th training
example in class K on the j-th test example in class K.
Due to the single-file-size limit of 100 MB, we split this file into
part-1,
part-2, and
part-3. The full .npz file
can be reconstructed by concatenating the parts together:
cat imagenet_infl_matrix_split_*.bin > imagenet_infl_matrix.npz
The md5sum for the concatenated file is 20290f49a0468de7973892dc47f85e54.
CIFAR-100 Pre-computed Memorization and Influence Value Estimates
We provide pre-computed memorization and influence value estimates on CIFAR-100 for download here. The estimates
are computed by training 4,000 ResNet-50 models, each on a random 70% subset of the full CIFAR-100 training set.
The estimates are provided in the original data order from the
official CIFAR-100 website. We also provide
tr_labels and tt_labels to help sanity check the data ordering.
-
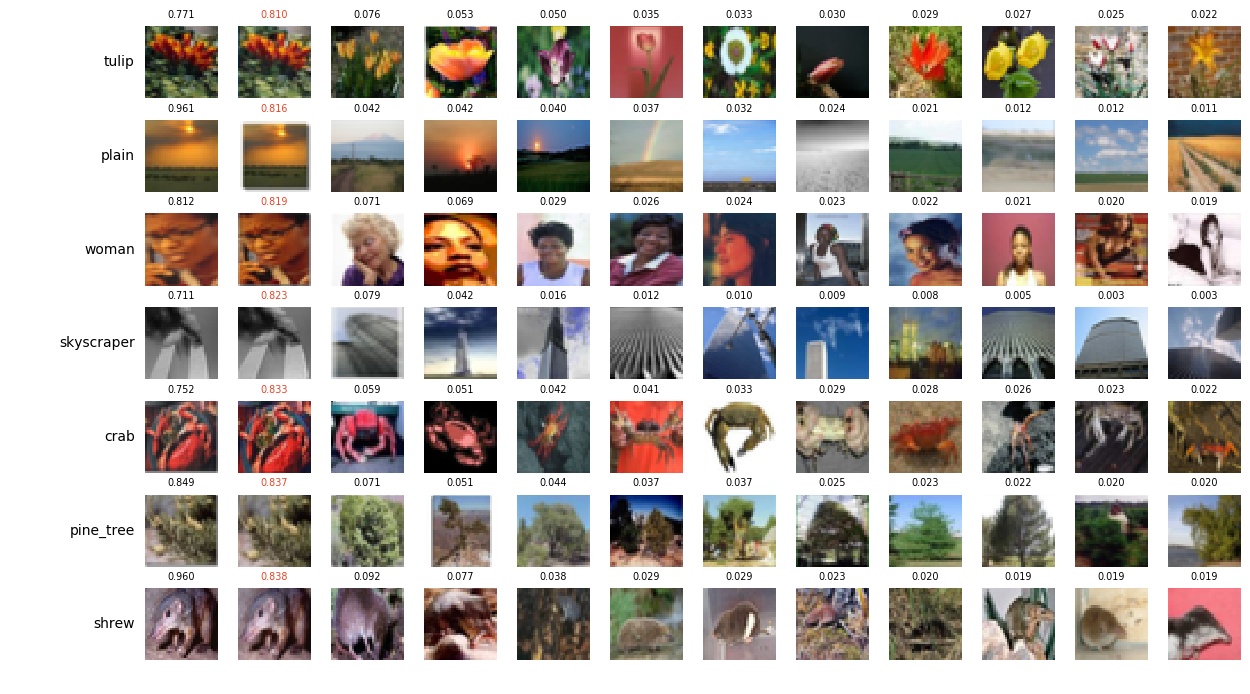
High-influence pairs
contains four arrays of equal length.
tr_idx and tt_idx contains the
index of the training and test examples, respectively, from each of the selected high-influence
pairs. infl contains the influence estimates for all pairs, and mem contains
the memorization value estimates of the training example in each of the selected pairs.
-
Class-wise influence matrices contains the
n_train-by-n_test influence matrices for each class
K
in the array with name infl_matrix_class{K}. The array tr_classidx_{K}
and tt_classidx_{K} provides the index of examples that belong to class K
in the training set and test set, respectively. tr_labels and tt_labels
provide the labels on the training set and test set, respectively, to help sanity check the data ordering.
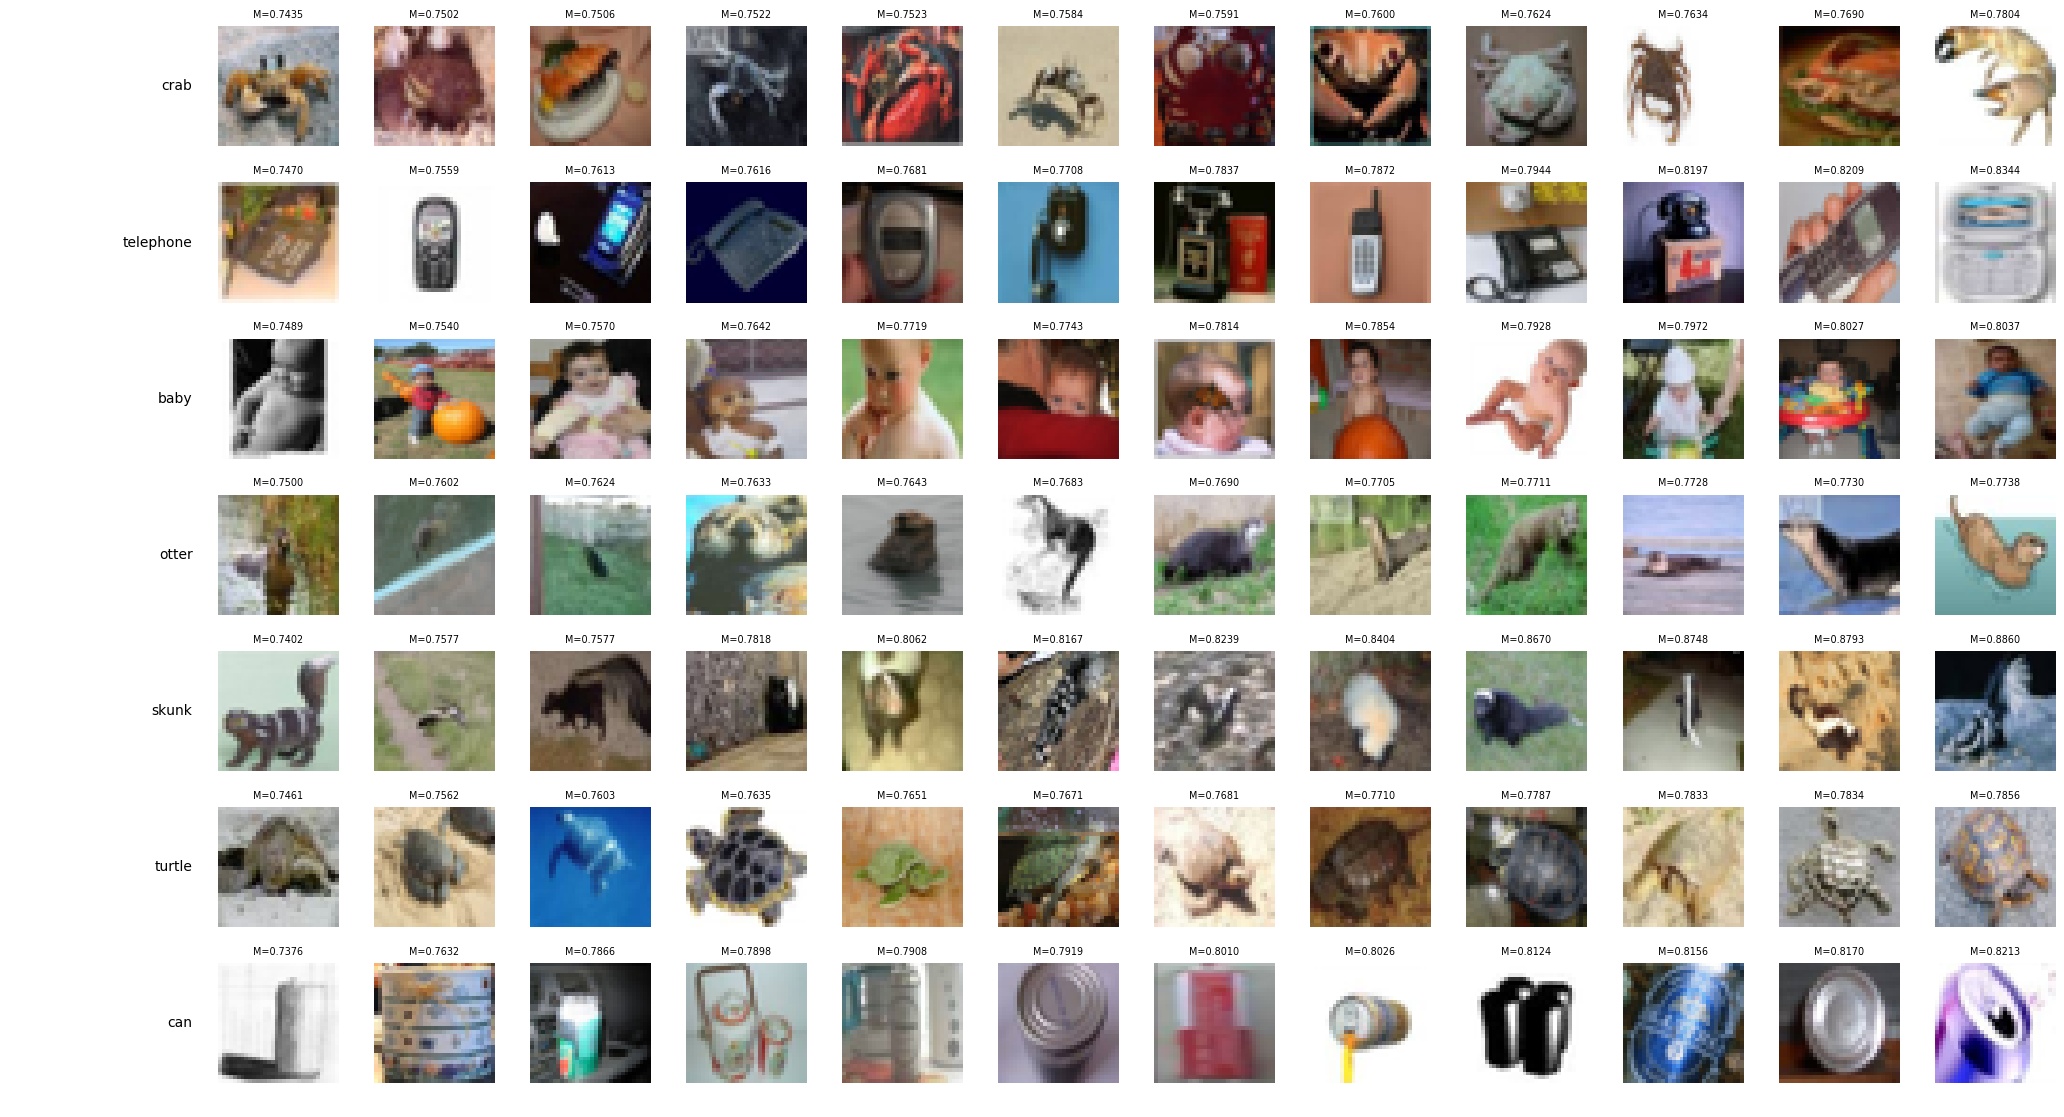
Finally, tr_mem contains the memorization value estimates for all the training examples.
Pre-trained Model Checkpoints
We also released the checkpoints for the models trained with different heldout subsets.
The download links and details on how to load those checkpoints can be found
here.